
Exploiting Fear and Greed for Fun and Profit
The Fear & Greed Index
The Crypto Fear & Greed Index is a composite indicator that turns several measures of market activity and investor sentiment into a score between 0 and 100. Low values represent fear, while high values represent greed. For our backtests, we use the Crypto Fear & Greed Index published by Alternative.me.
Its two largest components are Bitcoin volatility and market momentum with trading volume, each weighted at 25% and compared with their averages over the previous 30 and 90 days. Social media activity accounts for 15%, while Bitcoin dominance and Google search trends account for 10% each. Together, these inputs try to capture how cautious, confident, or speculative the crypto market is at a given moment.
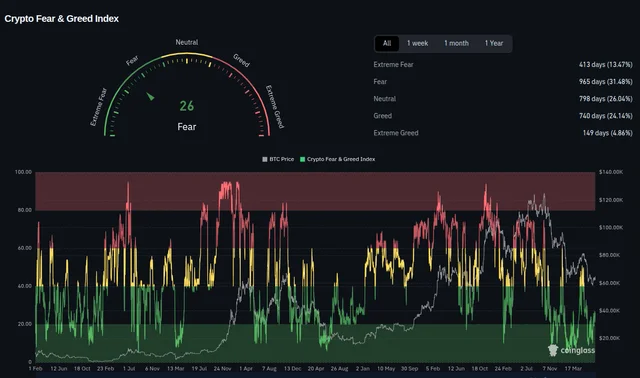
The index measures sentiment. It has no context for whether Bitcoin is cheap or expensive across different cycles. Still, the intuition behind it is appealing: buy Bitcoin when people are afraid, and sell BTC (or keep some cash for later) when they become greedy. We wanted to see whether this simple idea could improve a $50 daily Bitcoin DCA.
The study period runs from February 1, 2018, the beginning of the available Fear & Greed history, to today.
The challenge
View the post on X
You get $50 every day to invest in Bitcoin, starting on February 1, 2018. You also get access to the Crypto Fear & Greed Index.
Every day, you have a choice. Buy BTC immediately, keep the cash for later, or sell part of the BTC already accumulated when greed gets too high.
How can you use this indicator to beat a simpler strategy that buys Bitcoin every day?
We’ll make 3 attempts to squeeze more return from Fear & Greed alone.
Strategy 1: Buy fear, sell greed
A first approach could be to buy Bitcoin when the market falls into fear, then gradually sell when it reaches greed.
This idea comes from a strategy published by Bitcoin Magazine. It allocates 1% of its capital to Bitcoin when the index is at 20 or below, then sells 1% of its Bitcoin when the index reaches 80 or above. The article reports that this approach beats buy and hold over the period tested.
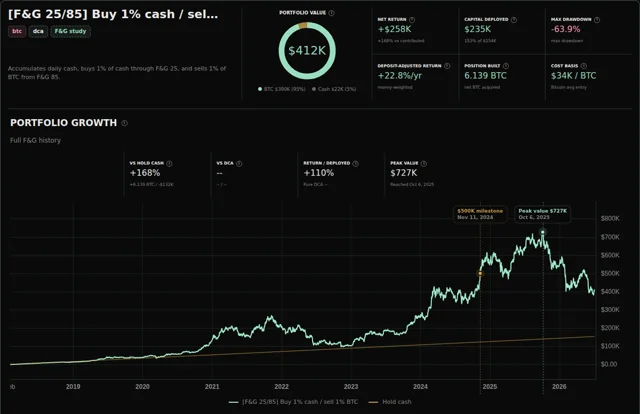
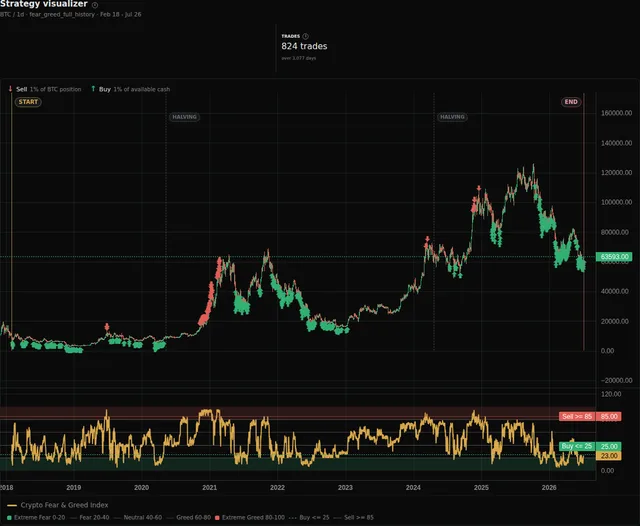
We adapt the idea to our setup: when the index is at 25 or below, the strategy buys Bitcoin with 1% of the available cash. When it reaches 85 or above, it sells 1% of the current Bitcoin position. The proceeds remain in cash for future buys. Between 26 and 84, it does not trade and simply adds the daily $50 to its cash reserve.
Over the backtesting period, about $153,000 contributed becomes $412,000, a 168% return. The strategy holds more than 6 BTC and keeps about $21,000 in cash to buy the next dips. Nice.
Let’s see if we can do better.
Strategy 2: Extreme fear only
One way to improve the first approach could be to stop selling Bitcoin completely and stop trying to time the market so much.
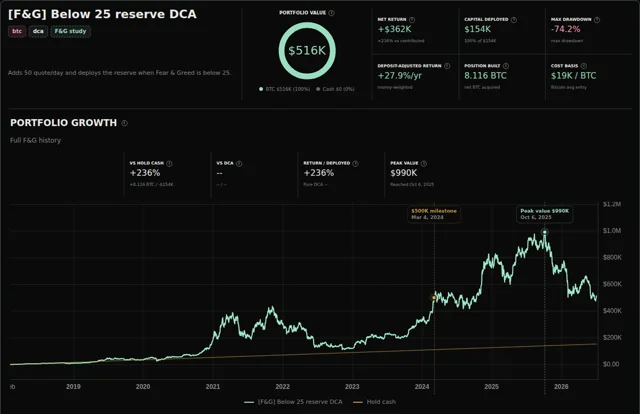
Let’s cut one leg from the previous strategy: we’ll buy only when there’s blood in the streets. The strategy still receives $50 every day. While the Fear & Greed Index is at 25 or above, the cash accumulates. As soon as the index falls below 25, it invests the entire available reserve into Bitcoin. If extreme fear continues, each new daily $50 is invested as well.
Over the same period, with the same amount contributed, the strategy ends with a portfolio worth $516K, entirely invested in 8.116 BTC.
That’s a 236% return, much better than the first strategy.
Let’s see how we can improve it even further. One thing stands out in the trades.
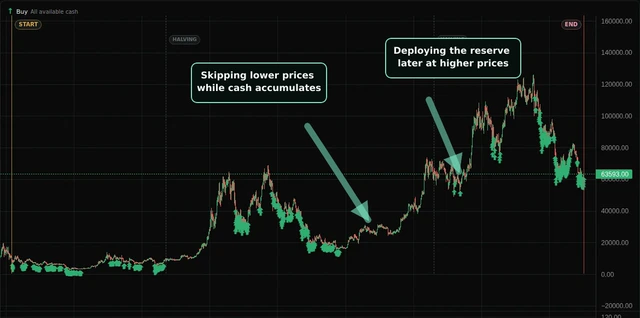
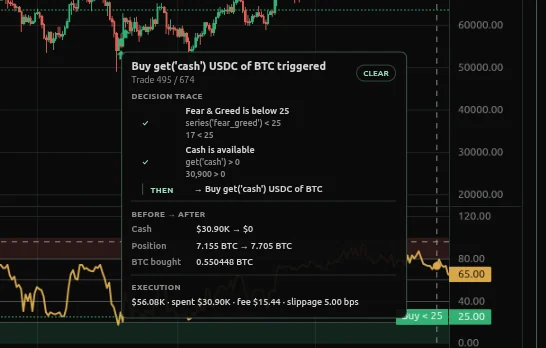
One trade makes the problem clear. The strategy skipped buys below roughly $45K, then deployed $30.9K at around $56K.
The cash reserve graph shows the same behavior: long periods of accumulation followed by a full deployment.
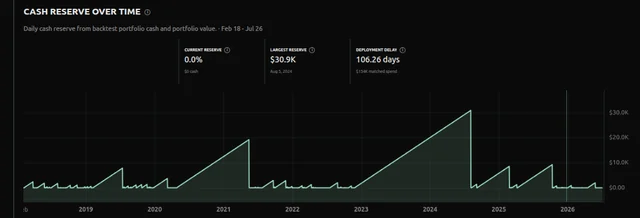
This pushes the average entry price higher and times the market awkwardly.
Strategy 3: Skip greed, deploy reserve in extreme fear
The next approach is closer to pure DCA. We now buy Bitcoin every day while the index is at 70 or below. Above 70, when the market is too hot, the strategy pauses its daily buys and accumulates cash in the reserve.
Daily buys stop only when Fear & Greed is above 70. During extreme fear, when the index reaches 15 or below, the strategy deploys 10% of the accumulated reserve each day.
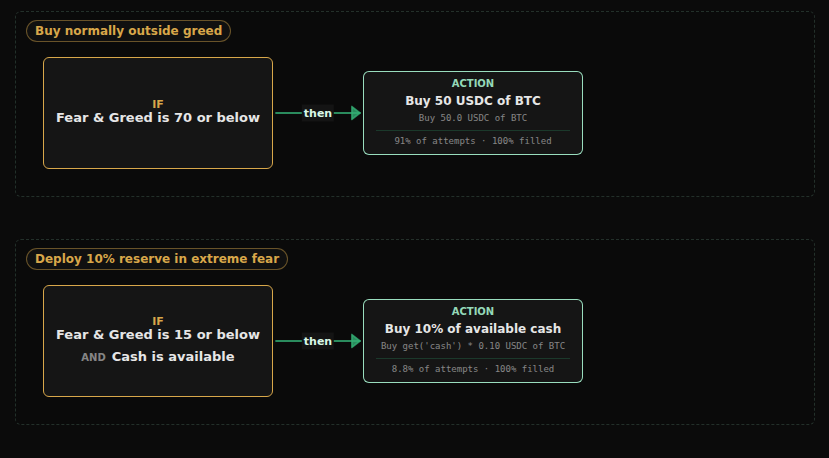
Over the same period, with the same amount contributed, the strategy ends with a portfolio worth $609K, entirely invested in 9.581 BTC.
That’s a 296% return, even better than Strategy 2.
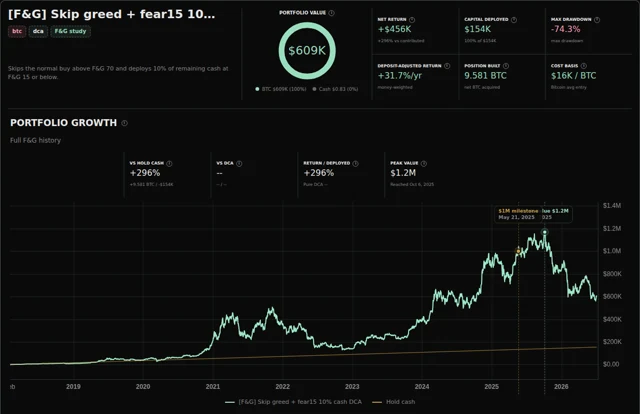
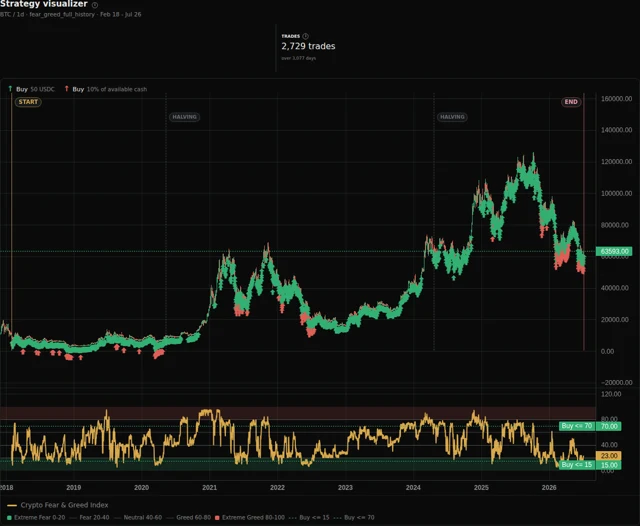
3 Fear & Greed attempts. Each one beats the previous one: $412K, $516K, then $609K.
These 3 were not picked at random. We tested a broad matrix of Fear & Greed thresholds, buy and sell rules, and cash deployment methods across the full backtesting period, covering multiple Bitcoin cycles. They are not necessarily the 3 best possible combinations, but they are representative of what simple approaches using only Fear & Greed can do over a long period.
Pure DCA destroys all 3
Now the brutal truth: over the same period, a simple daily DCA performs better than the 3 strategies above.
Buy $50 of BTC every day.
That’s it.
It accumulates 9.7 BTC for a 300%+ return. The dumbest strategy in the lab destroys all 3 attempts to squeeze more return from Fear & Greed alone.
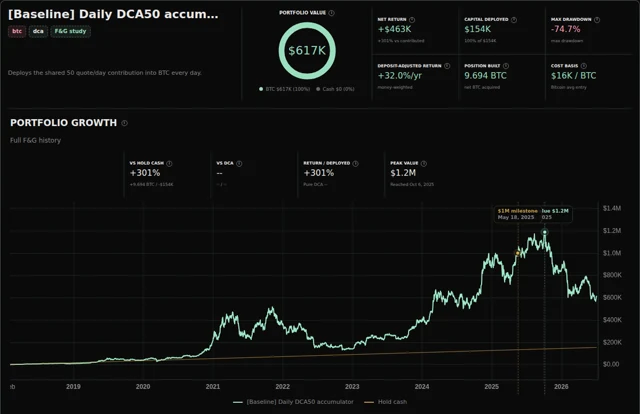
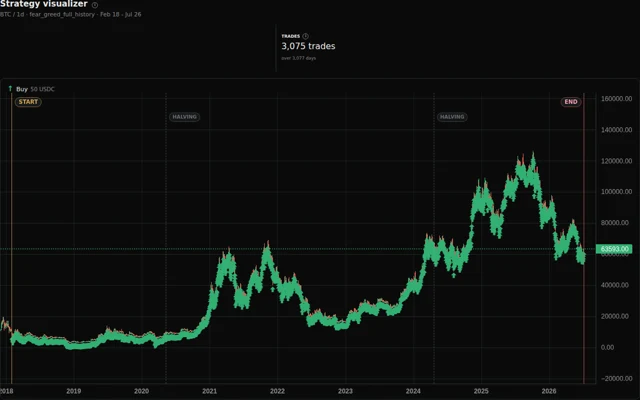
What’s the lesson here?
All 3 attempts to improve returns with Fear & Greed failed against a simple DCA strategy.
So, at this point, the lesson looks simple. As @0_3_BTC puts it: “Small consistent buys + patience beats timing the market every single time.”
View the post on X
A strategy that already beats DCA
Could “every single time” be too bold a conclusion, though?
We found one counterexample.
The base is one of Strategy Lab’s simplest DCA-beating strategies: the 200 weekly MA value reserve strategy.
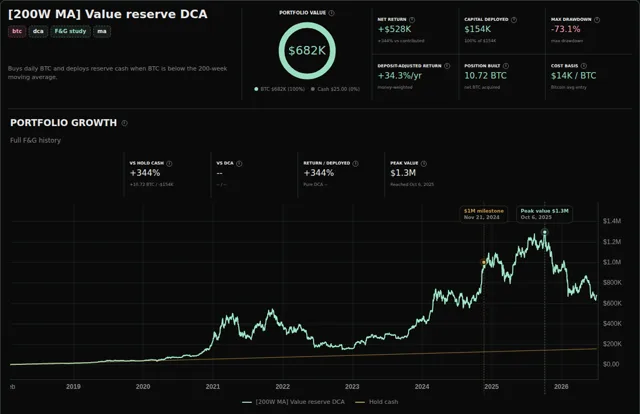
Like the other strategies, it receives $50 every day. It buys $25 on ordinary days and keeps the other $25 in cash. When Bitcoin falls below its 200 weekly MA, it deploys the full reserve.
Its only signal is Bitcoin’s price relative to the 200 weekly MA. Over the same period, it turns the same $153,750 into $682K, accumulates 10.72 BTC, and returns 344%. That’s $65K more than pure DCA.
Add one Fear & Greed rule
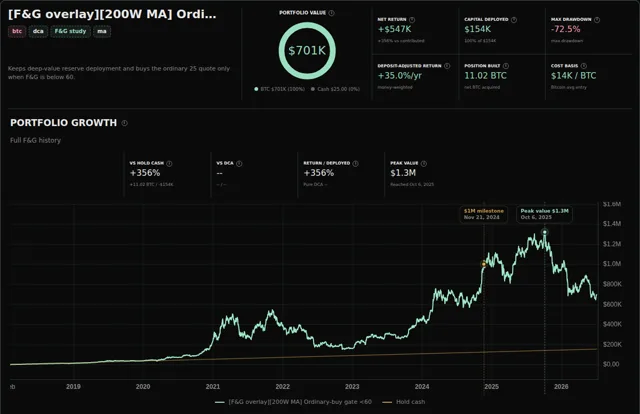
Now we add one small Fear & Greed rule on top of this strategy. The 200 weekly MA reserve deployment stays exactly the same.
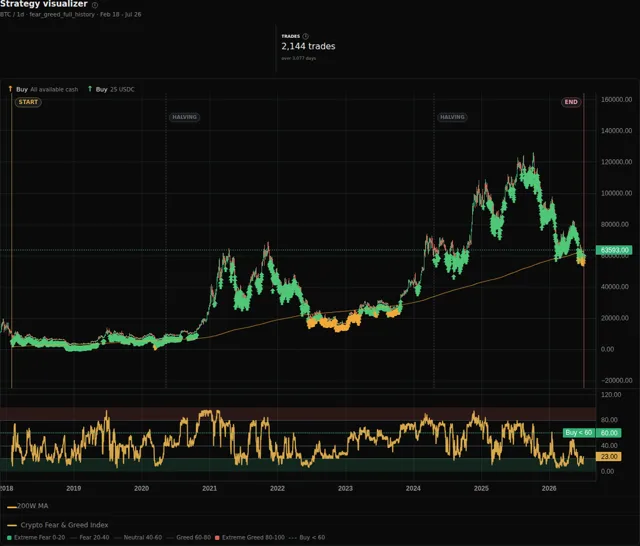
On ordinary days, however, buys are filtered out when Fear & Greed is at 60 or above, in the greed zones. The accumulated cash is later deployed when Bitcoin falls below the 200 weekly MA.
This time, the result passes the $700K mark, with more than 11 BTC and a 356% return.
A simple Fear & Greed flavor, like a cherry on top of an already winning strategy, adds nearly $19K to it.
Conclusion
Fear & Greed worked best as a small filter on top of an already winning strategy. In that role, it added nearly $19K. When it controlled the whole strategy, simple DCA beat every version we tried.
Fear & Greed has plenty of other possible uses, and we barely scratched the surface here. The point of the study was to show why every trading idea needs a proper backtest.
We’re building the tools traders need to do that in the agentic era.
For this study, LiSA tested more than 30 strategies generated on the fly. Without the proper tools, this would have taken ages, even with GPT generating some Pine Script for you.
We’ll soon showcase how the workflow works, then open the tools to traders.
We can’t wait to see what other traders come up with.